How eMoods Aided My Recovery And Inspired My Data Science Career
February 23, 2021
I’ve been an eMoods user since high school when my psychologist, a dialectical behavioral therapy (DBT) practitioner, suggested I use it to track my moods instead of paper spreadsheets. I was unconvinced. I had attempted various daily practices in the past and consistently failed after a week or two. But something about eMoods (and my no-BS psych) stuck. eMoods became part of my evening ritual, a staple in my routine. I kept it up even after I wasn’t required to send reports to a therapist.
I kept the idea of “doing something cool” with my eMoods data in the back of my head for years. It wasn’t until my senior year in college, when I hit a rough patch with my mental illness, that the idea started to take form.
The collapse
My October 2017 collapse was swift; it began around ten days before I was hospitalized. I can see the day I entered the hospital in my journal, my handwriting changes from black ink to gray magic marker. My partner drove me to the hospital in downtown St. Paul one evening after I realized my latest attempt at death was not likely to kill me but would be nearly impossible to hide.
Inpatient treatment is useful for stabilization. The object is to get you through the moment and continue work once you’re discharged. The hospital psychiatrist adjusted my meds abruptly, which would have otherwise been dangerous. Occupational therapists taught me sensory techniques for distress tolerance. I met other patients, too.
I met a lawyer with bipolar disorder. Once she was calm and safe, she seemed to treat the ordeal like an unpleasant surprise dentist visit, simply a culmination of her internal biology and external situation. I was inspired by how deeply she seemed to know herself.
I had to evaluate my life. I wrestled with delaying my graduation by dropping classes, stepping down from leadership roles and committees, and starting an intensive outpatient DBT program. My schedule shifted accordingly.
My pre-hospitalization agenda reveals intricately crafted, color-coded schedules and to-do lists. I had prized excellence and perfection above all else. When I fell behind in homework or missed a deadline, the failure drove up my shame and worthlessness exponentially.
The pages after my discharge seem empty by comparison. A few assignments here and there. Application deadlines I gave up on and crossed out. I shifted from gathering supplies to harm myself to compiling a survival kit. Items included a small woven pouch filled with dried lavender I would fold into my scarf and a tiny pendent of St. Jude, lovingly lent by my partner. My priorities changed dramatically. Rather than setting my sights on thriving, I was delighted to simply make it to the end of the semester alive.
The postcards
After my inpatient treatment, tracking my mood daily was insufficient. I started documenting by the half hour[1], quantifying and charting my depression, anxiety, and suicide and self-harm urges. I watched my mood shift from euphoric to apathetic, suicidal urges range from 0 to 10 in a matter of hours. I annotated each peak and valley with specific actions and decisions. I saw the way my anxiety revved up as I grappled with whether to withdraw from a class and decline once I made the decision. My mood was less volatile on days I convinced myself I was worthy enough of food to eat lunch. I noticed the massive drop in intensity when I had a long, home cooked dinner with friends.
At first, I used a sketchbook gifted by my professor.[2] Later, I used gridded cardstock to make postcards and mailed them to my sister.[3] Taking the time to examine my day coupled with the gratitude I felt writing to my sister was grounding. I felt liberated each time I dropped a card in the mailbox and let the stress of the day be carried away. I built up my confidence in sharing my data and crafting interesting visuals to describe thoughts and feelings. That’s when my schoolwork and self-work came together.
The static visualization project in my cartography and geovisualization class was the equivalent of a midterm exam. I was overwhelmed by the idea of attempting a design that would meet my own standards, learning the data, making drafts and edits, proofreading, and learning the quirks of Adobe Illustrator. Not only did I want a good grade, but I also wanted to make something meaningful.
My priorities had shifted to my mental health, so why not make my project about that?
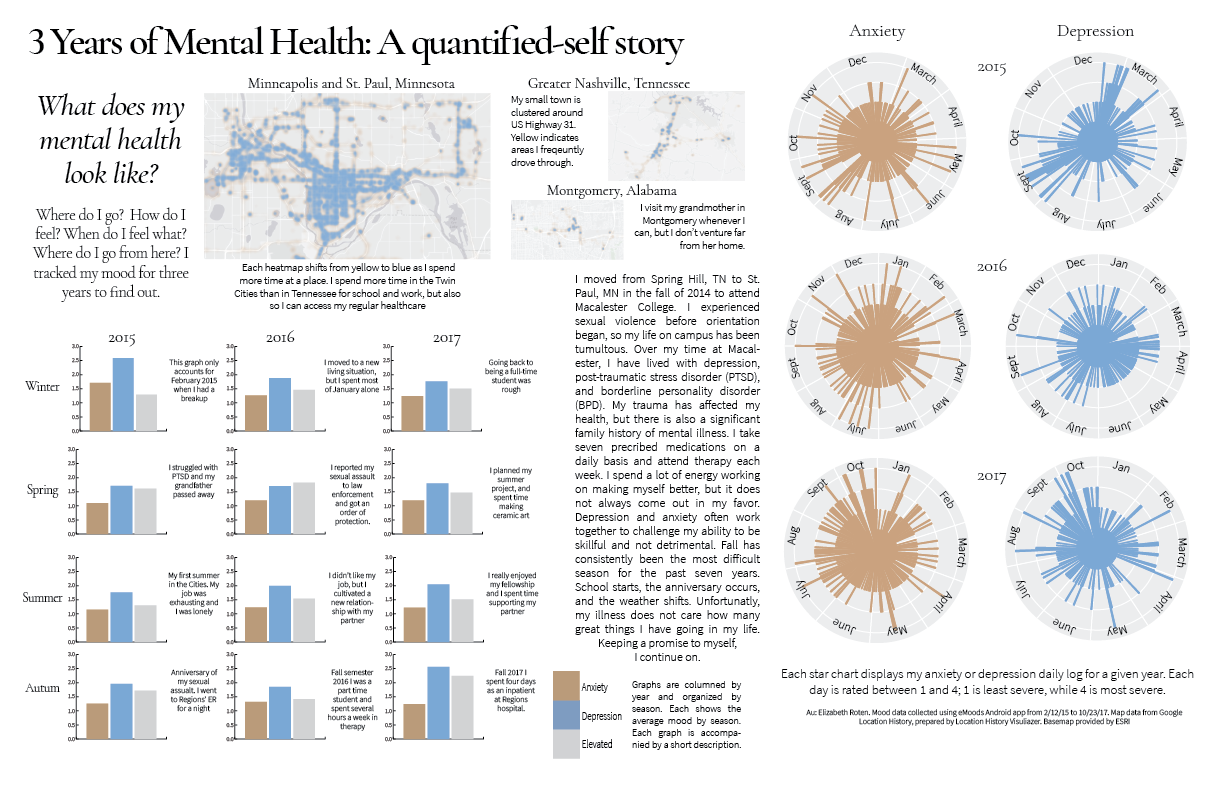
I turned to eMoods and exported years of data. I clumsily made plots in R and exported them to Illustrator for finessing. I complemented the mood plots with my Google Location History, highlighting areas where I spent my time over the years. I agonized over the typeface, spacing, font kerning, visual hierarchy, and color. It felt less like a difficult assignment, and more like a forensic investigation. 3 Years of Mental Health - A quantified-self story.png3.71 MB
When I turned in my project, I found that I didn’t care about the grade. I took pride in my work and let that beat down my shame. I committed to my recovery and let my viz help me prepare for next semester.
After
That spring, I took full-size color copies of the viz with me to a job interview. The eMoods viz was my best work, and yet it felt akin to walking in and shouting “By the way, I’m crazy! Please hire me.” I got the job and made my professional home in data science.
The novelty of my mood data has never worn off. I keep finding new ways to visualize and interact, growing my data science skills with each step. eMoods sparked my interest in data science and my curiosity expanded to spatial demographic patterns, greenhouse gas emissions, and regional parks research.
eMoods did not, and will not, cure me or reduce my symptoms on its own. But in the same way that you cannot pound a nail into wood without a hammer, nor knit a sock without needles, eMoods is an essential tool in my daily well-being.
There isn’t a happily-ever-after in this paragraph, but I’m doing okay. I fill out my eMoods card each night before bed, stowing away data for the next project.